(A version of this article previously published under the ‘EVOLUTION’ tab)
TESTING HULLS IN (ALMOST) REAL CONDITIONS
A few years ago, I had the pleasure of being part of a ground-breaking study at Chalmers University of Technology.
We set out to focus on the performance of 3 different 41′ racing hulls designed by us, mysteriously called A, B and C. The tests were made in different wave lengths, using CFD.
Testing these hulls virtually is extremely demanding on computer capacity: Each test run of each of the hulls in each wave scenario required 28 fast PCs hooked up in a cluster, running for up to 24 hours.
The tests showed a good accuracy, as checked against previously known research in other studies.
But not least, the output from these files shows astonishing detail.
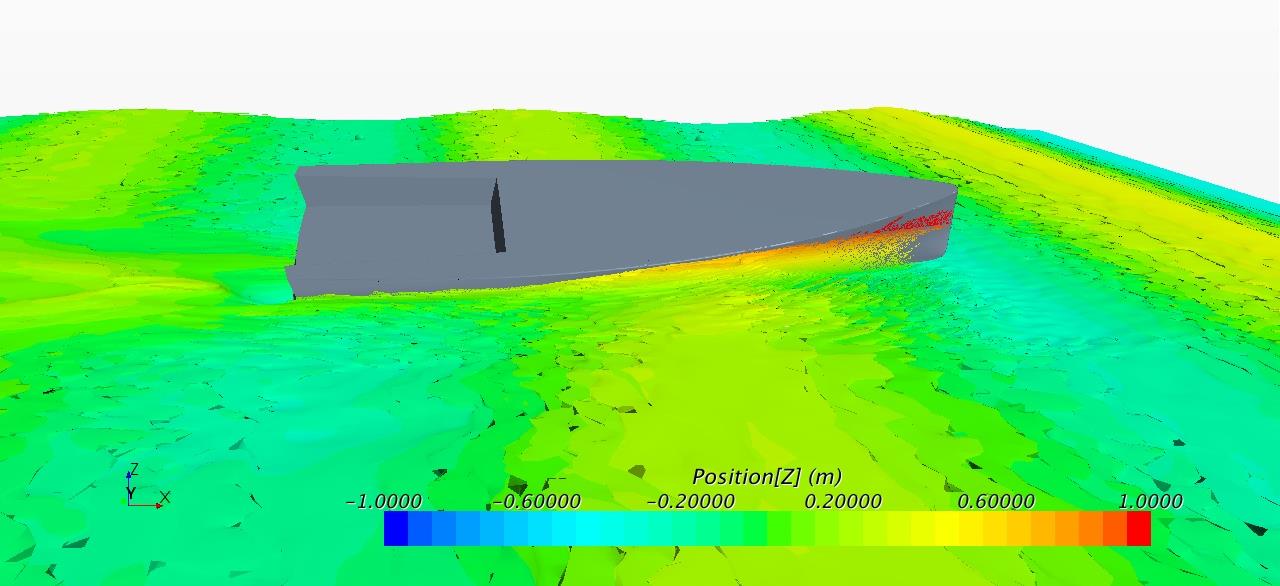
For each simulation a series of images was produced; shown below is an example, in this case hull C running into a head sea with a wave length equal to the hull length. Notice the curtain of water flowing from the freeboard forward as the bow has just launched out of the wave peak, indicating the high precision achieved.
Not so many years ago, simulations like these would have been technically impossible to perform. Even today, they are rare indeed.

25 COMPLETE CALCULATIONS, EVERY SECOND
The simulations were calculated at a rate of 25 per second, with each one showing data readings of pitch, heave, wave encounter, local pressure on hull surface, drag, and speed.
The images were then spliced together, creating a film of each wave scenario – here is one example:
WHAT DID WE LEARN?
Our tests were both revealing and confusing – we did understand more about which kind of hull shape will offer the lowest drag in different wave patterns, but at the same time the amount of data gathered was so huge, and so new, that until now we have spent countless hours evaluating the results.
Adding to the difficulties, it is possible to interpret some of our observations in a number of different ways and we have sometimes found ourselves in new territory.
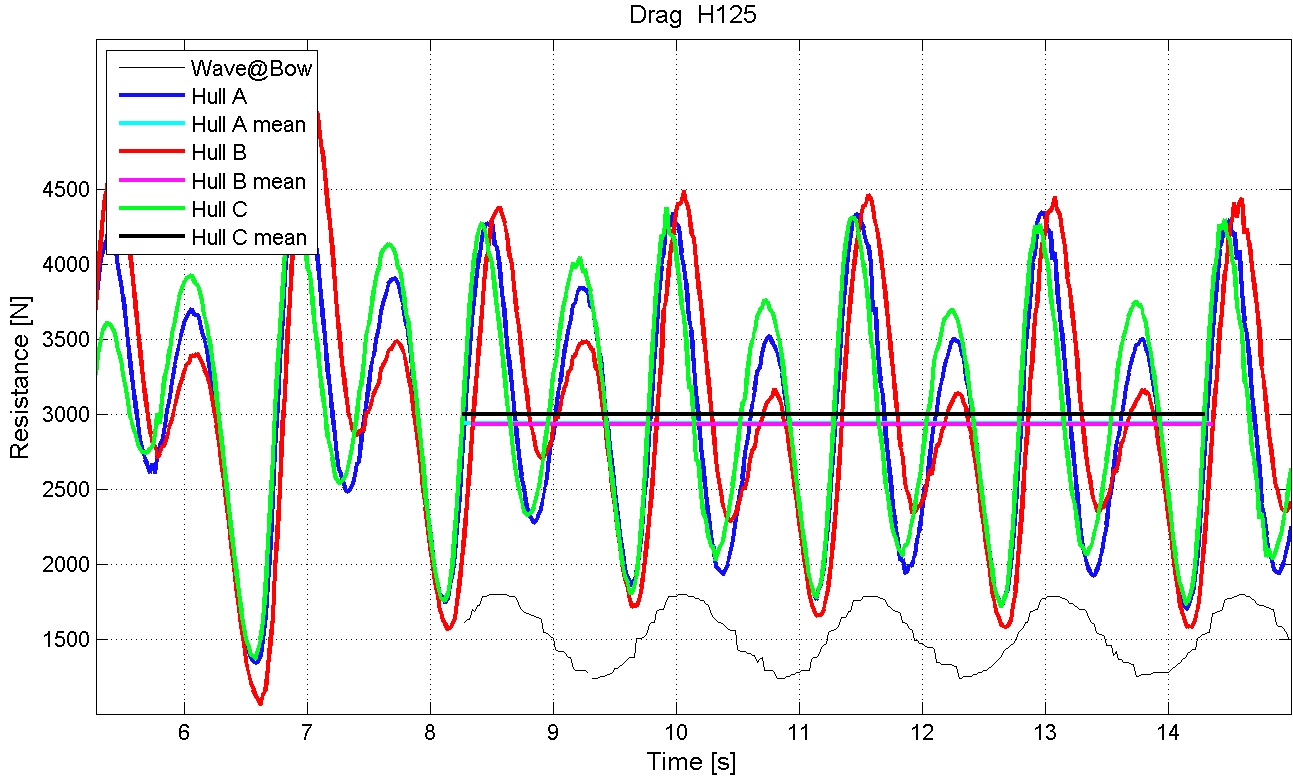
This is an example of the resistance curve for one of the wave cases, one particular speed, and 3 different hulls.
The conclusions will not be very obvious, will they?:
IN RESEARCH, ALWAYS QUESTION YOUR RESULTS
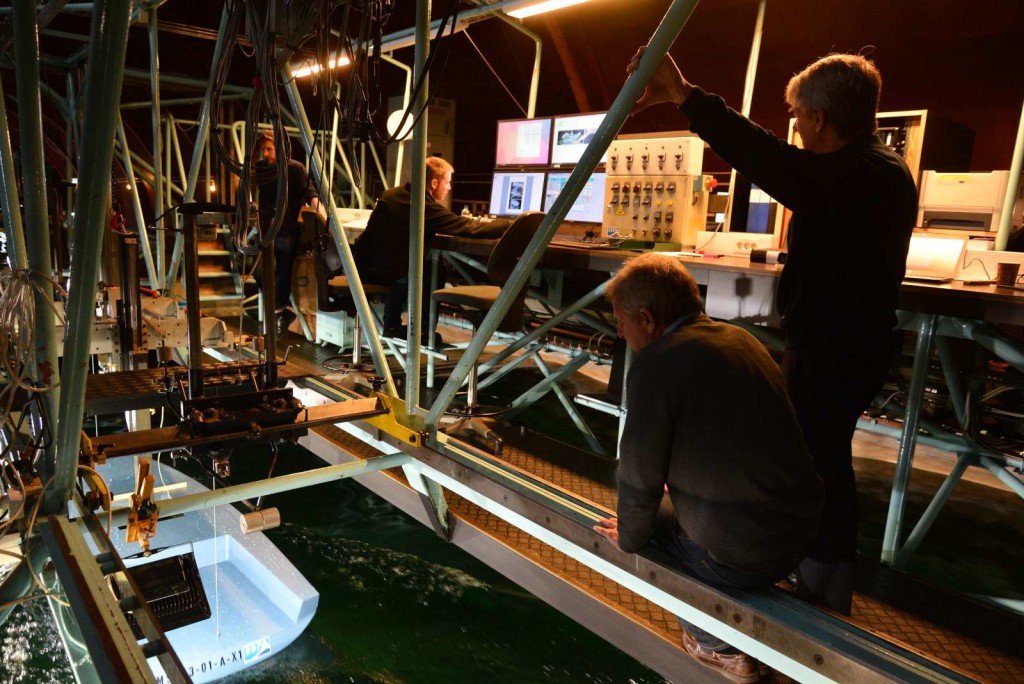
After some deliberation we came to the conclusion that it was necessary to validate our methods against other standard tests. Therefore, a series of tank tests were performed on 7-8 February 2017. We were using the facilities at SSPA – the test tank is 260 m long, with perfectly calibrated wave generators. This is a view of the test setup, taken from the 23 ton test carriage holding the model:

Closest in the image above are Professor Lars Larsson, the hydrodynamics wizard at Chalmers and the driving force behind both studies (standing) and Matz Brown, in charge of yacht testing at SSPA (sitting). The model is attached below the carriage which is running along the tank, in this case, at a speed corresponding to 7,5 knots.
Seen at different speeds and in different wave scenarios, this is what the tests could look like:
DO THESE TESTS HAVE ANY PRACTICAL USE?
Oh yes. Very much so.
The 3 hulls tested are used as a template, or reference, for further refining our designs at Heyman Yachts. Hulls, keels, rudders, sail plans.
As an example, we made a first presentation of the development of the Heyman 34′ Sport here 3 years ago, more than one year before the prototype was launched
The prototype has now been tested for two full seasons and offers very unusual speed potential. Not only that, but also a perfect handling.
Read more about the performance of this boat here, or here
(c) Gabriel Heyman, August 2022
